By Cristina Furlong
On Tuesday, April 28th, students from IS 230, The Magnet School for Civics, in Jackson Heights celebrated the completion of an innovative traffic safety program. The Traffic Safety Sign Design Program pairs safety educators from the Department of Transportation (DOT) and the arts-advocacy group Groundswell to create site specific and beautiful traffic signs for school zones. The 7th grade “Art Talent Class” at IS 230 spent weeks with artist Chris Soria, safety educator Julia Glauboch, as well as their art teacher, Ms. Bonilla to create the work. The program included a neighborhood traffic survey and a trip to the DOT sign making shop in Maspeth, where up to 12,000 signs are fabricated each month.
“This school year, DOT safety educators have been reaching out to middle school students, one of the most vulnerable groups for traffic related injury. “ said Theresa Berry DOT Safety Education and Outreach Director of Special Events for Vision Zero. “Vision Zero accepts no traffic fatality as inevitable. The success of Vision Zero involves fully engaging the public to become part of the solution”. Berry said.
The partnership of DOT and IS 230 has been going strong for about a year, since Make Queens Safer members provided information on DOT programs to the former PTA president. It was arranged that Safety Educators would come to the school and address parents at a PTA meeting. Last fall, students participated in the Make Queens Safer street fair and traffic study, for which they received community participation credits for class.
Dr. Laura Newman, from Make Queens Safer spoke about the incredible  partnerships and community that were involved in the process. Dr. Newman recognized that IS 230 had lost a former classmate, Luis Bravo to a hit and run driver over a year ago. In his honor, 2015 will mark the first year of the Luis Bravo scholarship to a graduating 8th grader. The school was fully engaged through participation from the parent coordinator, guidance counselor, principal, art, civics, social studies, band and math classes, highlighting the fact that safety education can be incorporated into common core curriculum in many ways.
Students spoke about the experience being a long lasting one for them, whether it was the new awareness of traffic safety, the enormity of the sign-making process of New York City, or the collaborative creative process.
“At Groundswell, we like to say that art creates community, and community creates change” said deputy director Sharon Polli. “The creative process begins with a challenge. The challenge that all of you faced was how to work together to create a dual image that increases safety awareness and prevents accidents around your school.” You have created change. The message you have all created will resonate with thousands of community residents and your fellow students.”
Other members of the DOT present were Kim Wiley-Schwartz, Assistant Commissioner of Safety Education, and Marjorie Marciano, DOT Vision Zero safety educator. “You have a right to be safe on your walk to school” Wiley-Schwartz said.
Make Queens Safer is hoping to make contacts with man y more schools in Queens to help facilitate the implementation of safety programs for students of all ages. Beyond the DOT, there are many resources for parents, teachers and students.
In the coming year, we hope to create resources for parents and concerned neighbors to report unsafe conditions and have a platform for which to make changes. Specifically, implementing safe procedures for arrival and dismissal, ensuring crossing guards for dangerous intersections, promoting walking and biking to school, and increasing the well-being and participation of school communities as it relates to traffic safety.
If you are interested in working with your school to have a traffic safety program or presentation, don’t hesitate to contact us via facebook message, or info@makequeenssafer.org for tips and resources.


 partnerships and community that were involved in the process. Dr. Newman recognized that IS 230 had lost a former classmate, Luis Bravo to a hit and run driver over a year ago. In his honor, 2015 will mark the first year of the Luis Bravo scholarship to a graduating 8th grader. The school was fully engaged through participation from the parent coordinator, guidance counselor, principal, art, civics, social studies, band and math classes, highlighting the fact that safety education can be incorporated into common core curriculum in many ways.
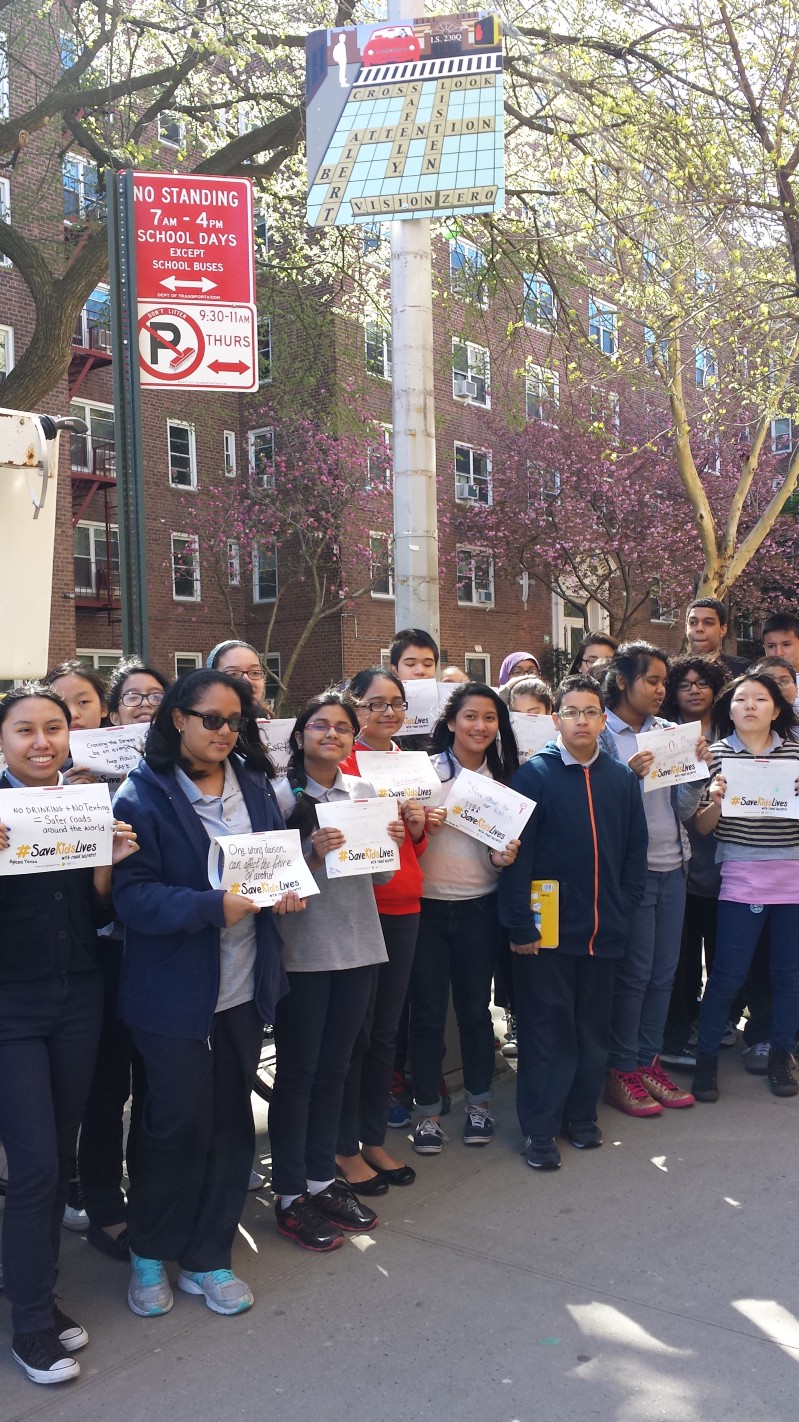 y more schools in Queens to help facilitate the implementation of safety programs for students of all ages. Beyond the DOT, there are many resources for parents, teachers and students.